News & Insights
Insights
[Insights] Are Stocks Currently Expensive Or Cheap?
23.09.2019
This is a question investors are always asking when buying stocks. When would be a better time to buy stocks? Is it now, or later?
In the previous article, we showed a high correlation between stock and bond prices. In this article, we will use US Treasury Bonds (T-bonds) as a benchmark in evaluating whether stocks are currently expensive or cheap.
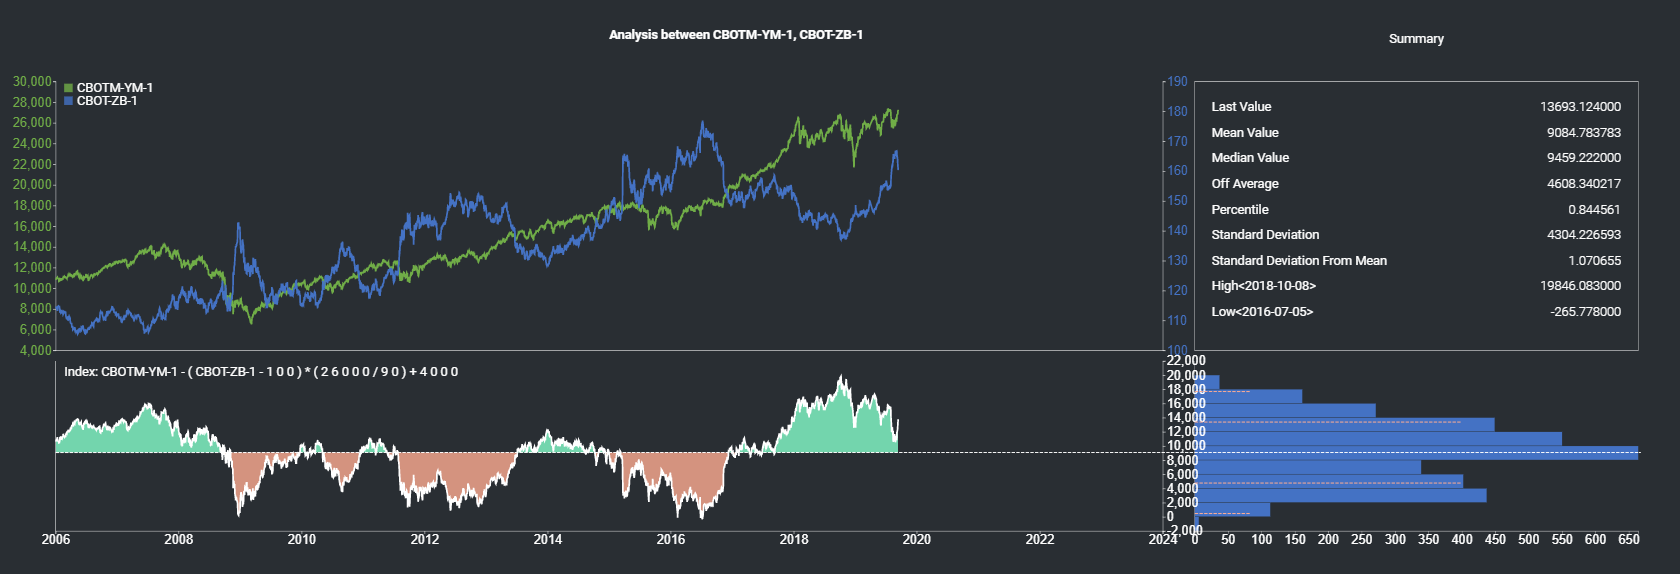
Using the Spread Analysis Model from MAF Cloud, we are able to plot the Dow Jones Stock E-Mini Futures Price against the US T-Bond futures. This would allow us to compare current stock prices to their theoretical (bond-benchmarked) values, and identify if stocks are considered cheap or expensive at that point of time.

From the graph above, we can see the periods when stocks are expensive (the areas marked green) relative to bonds, and when they are cheap (the areas marked red).
Basing off the model, we are able to derive a mean value of 9084.78 and standard deviation of 4608.34, as well as the lowest and highest values (-265.78,19846.08). We are also able to see the distribution of the spread between the two markets as a U-graph (see below to learn how the formula is derived).
In the past 3 years, stocks experienced strong growth relative to bonds, partly fueled by quantitative easing by major central banks which are driving yields down and stock prices up. As of current, stocks are moderately overvalued compared to bonds, with a z-score of 1.071, and are hence expensive to buy.
A smart investor would always pounce at the opportunity to buy stocks when they are cheap. By using our Spread Analysis Model, you would be able to tell when stocks are cheap – opening up an opportunity for you to purchase stocks that are undervalued. Would you try to spot for this opportunity to purchase stocks when they are cheap?
The Spread Analysis Model is also useful for comparing the relative value of commodities and currencies, showing the variance and relative displacement of 2 products. Do give it a try!
How to generate this graph on MAF Cloud:
For the Spread Analysis Model, set ‘Start Date’ as “2006-09-13” and ‘End Date’ as the current date. Select “Dow Indu 30 E-Mini” as ‘Product a’ and “T-Bond” as ‘Product b’. Set the 2 products for analysis as continuous (tick ‘CONT’) and input ‘Serial No.’ as “1” for both. Select the unit for both products as “Default”. Insert the ‘Formula’ as “a-(b-100)*(26000/90)+4000”.
How the formula was generated:
Dow Jones Stock E-Mini Futures Price = CBOTM-YM
US T-Bond = CBOT-ZB
The formula was derived by CBOTM-YM – [CBOT-ZB – (minimum of CBOT-ZB y-axis)] * [(maximum of CBOTM-YM y-axis – minimum of CBOTM-YM y-axis)/(maximum of CBOT-ZB y-axis – minimum of CBOT-ZB y-axis)] + minimum of CBOTM-YM y-axis = CBOTM-YM – (CBOT-ZB – 100) x (26000/90) +4000.
Click here to try MAF Cloud (Beta) for free today!
