News & Insights
Insights
[Insights] Are oil prices following the Breakeven Inflation rate?
09.09.2019
When it comes to investment opportunities, oil has always played an important role in helping investors diversify their portfolios. In recent years, there has been a growing interest regarding the relationship between oil prices and the Breakeven Inflation Rate (BEI), as there has been an uncanny resemblance between the movements of the two. By using the Cross-Correlation Model available in MAF Cloud, we are able to better understand how oil prices move with the BEI.
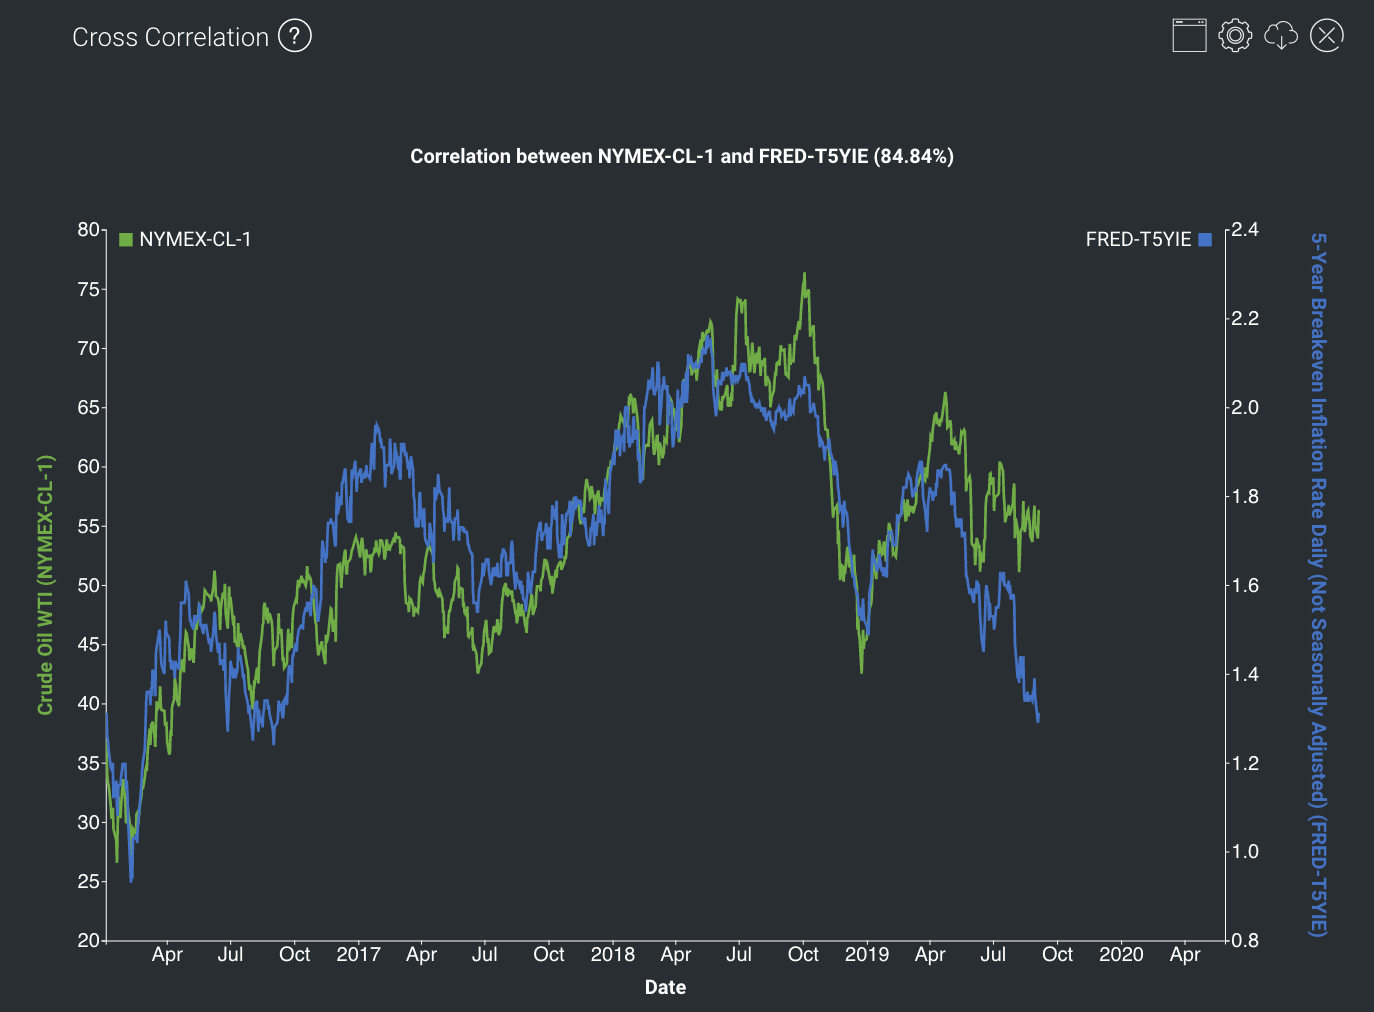
From the Cross-Correlation graph below, it is evident that they are significantly positively correlated (r = 84.84%) with each other, moving almost in lockstep through ups and downs from 2016 to 2019. The high correlation suggests that more often than not, when the expected inflation rate declines, oil prices would follow suit. However, in the recent few months, there seems to be a gap between the 2 trends: while inflationary expectations have declined substantially, oil prices have remained comparatively higher.

Oil Prices vs 5-Year Breakeven Inflation Rate
The historically close relationship between the two variables suggests that oil prices could be affected by inflation and/or vice versa. Both could be a reflection of consumer demand – if demand is weak, both oil prices and inflation would be lower. Meanwhile, shocks to oil prices can directly affect inflation as well – since oil is a key element for the production of many goods and services, rising oil prices translate into costs for consumers and hence lead to cost-push inflation.
From the graph above, BEI is now evidently declining faster than oil prices. Could this be an indication that investors expect future oil prices to decline? The ongoing trade war between US and China, and fears of a looming recession are already taking a slight toll on oil prices. This could be further lowered by Russia’s recent increase in oil production and the country’s potential exit from the OPEC deal.
Looking at the graph above:
- Is oil overvalued? Or have the prices already incorporated other factors outside of expected inflation rates?
- Are investors’ assumption of inflation rates too low? Or should inflation rates be higher? Or is the decline in expected inflation rate justified as people are preparing for a recession?
How to generate this graph on MAF Cloud: In the Cross-Correlation Model, select “Crude Oil WTI” (set continuous by ticking ‘CONT’ and ‘Serial No.’ as “1”) and “5-Year Breakeven Inflation Rate Daily (Not Seasonally Adjusted)” as the 2 products for analysis. Select the unit for both products as “Default”. Set ‘Start Date’ as “2016-01-01” and ‘End Date’ as the current date. ‘Shift Flag’ function is optional.
Click here to try MAF Cloud (Beta) for free today!
