News & Insights
Insights
[Insights] Do stock prices really go down when bond prices go up?
16.09.2019
Surely many investors would think this way, but is this for a fact, true? Do stock prices really go down when bond prices go up?
When looking at the short-term relationship between these two investment securities, stock prices and bond prices do truly have an inverse relationship with each other. However, when looking at a long-term relationship, it might prove to be a different story.
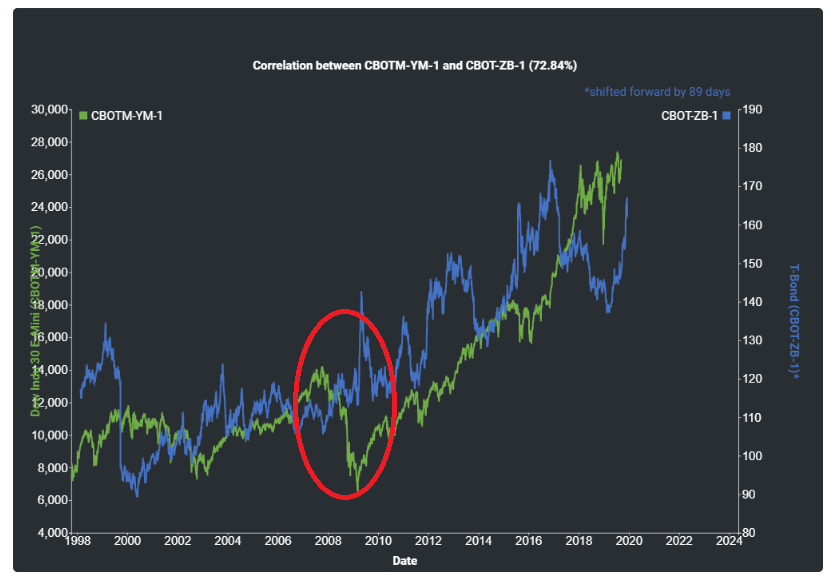
By using the Cross-Correlation Model available in MAF Cloud, we were able to put the Dow Jones Stock E-Mini Futures Price against that of CBOT US 30-Year T-Bond for a span of 20 years.

As evident from the graph, both securities actually prove to have a historically high positive correlation (r=72.84%) with each other.
Indeed, the two often move in opposite directions in the short run, especially seen in the crisis years 2008-2010. During times of uncertainty, stock prices will fall significantly, as investors seek safety in T-bonds, hence driving its price up. In general, stocks are much more sensitive to market cycles than bonds. Bond yield is often considered an indicator of investors’ confidence: during bull markets, prices of T-bonds will fall instead, as investors take on more risk and look for higher-return investments in stocks, causing it to outperform bonds.
However, as the two assets are affected by common market trends, they tend to move in the same direction in the long run. A lower bond yield would attract investors to invest in stocks that provide higher percentage returns. This is particularly evident when an economy is just recovering from a recession – both stock and bond prices move up in tandem, as interest rates are low and economic growth is expected to pick up. As the Fed is easing monetary policy recently to boost the economy, such a positive correlation is likely to be seen in recent times as well.
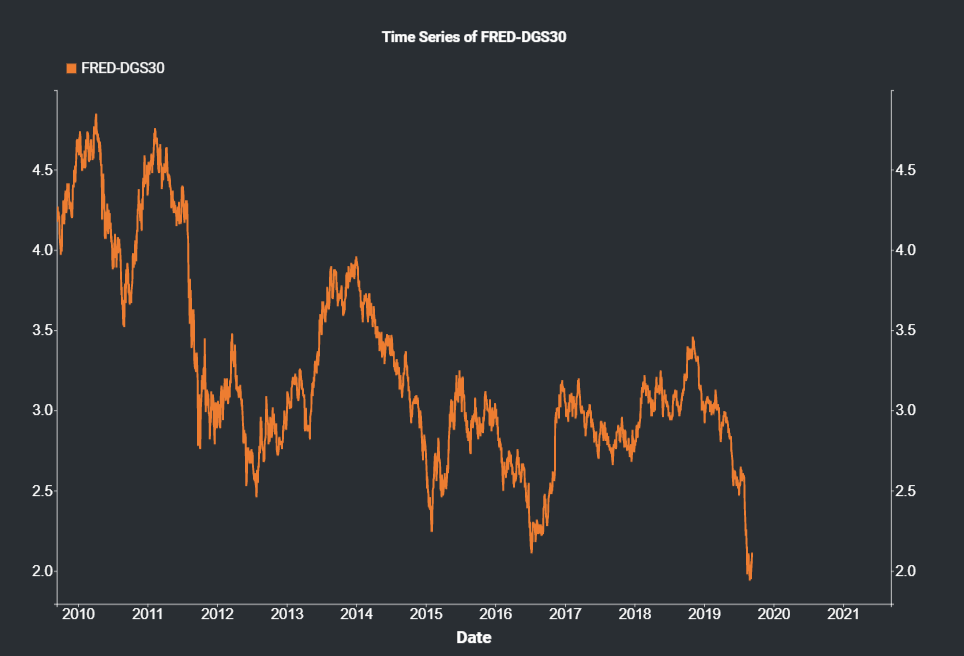
As investors, the prediction of future trends of bond and stock prices is essential. If bond yield continues to decline, the current upward trend of stocks could persist. However, could there be a limit to how low bond yields go? By using the Time Series Model available in MAF Cloud based on FRED’s 30-Year Treasury Rates, we are able to see the trend in bond yields in the past 10 years.

Looking at the graph, bond yields indeed seem to be in a downward trend. In the span of less than a year, yields have dropped from 3.46% to 2.11% (as of 12/09/2019). Does this mean that the FRED’s Treasury rates could potentially drop further? If it does, how high can stock prices go?
Several recent trends seem to be pushing yields even lower, such as ECB’s announcement on Thursday to resume quantitative easing and sustained asset purchases by the Fed, which can potentially push yields into negative territory. If we expect a positive correlation between stock and bond prices, we can expect a rallying of the stock market together with the bond prices in the future.
However, an important question investors may ask is: Is such a policy of lowering interest rates sustainable? Can the US T-bond yield turn negative and stay that way? It is not impossible, considering this is already the case for German bonds and shorter-term T-bills. Furthermore, the Fed’s plan to introduce 50- and 100-year bonds will expand the bank’s policy tools, providing further room to push down the yield curve in order to support an expansionary monetary policy.
Given the current situation:
- What should investor’s expectation of future yields (and hence stock prices) be? Would monetary expansion continue or eventually reverse?
- Is the current upward trend in stock prices driven by lowering yields or improving market sentiment? Are we entering a bull market, or would there be a correction if policy intervention ends?
Are current stock prices expensive or cheap? In next week’s article, we would be analysing this question using the Spread Analysis Model. So stay tuned!
How to generate the graphs on MAF Cloud:
For the Cross-Correlation Model, set ‘Start Date’ as “1989-09-12” and ‘End Date’ as the current date. Select “Dow Indu 30 E-Mini” and “T-Bond” as the 2 products for analysis. Set continuous (tick ‘CONT’) and ‘Serial No.’ as “1” for both products. Select the unit for both products as “Default”. ‘Plot Reverse’ can remain as “False” and ‘Shift Flag’ can remain as “True”.
For the Time Series Model, set ‘Start Date’ as “2009-09-12” and ‘End Date’ as the current date. Select “30-Year Treasury Constant Maturity Rate Daily (Not Seasonally Adjusted)” as the product. Select the unit for the product as “Default”.
Click here to try MAF Cloud (Beta) for free today!
